My month breaks even, so why does my balance get so low?
A month’s total compares two month-ends, both just after payday. In one sample budget, February ends $32.00 up and holds the year’s lowest point: $292.16.
By Fareed ·
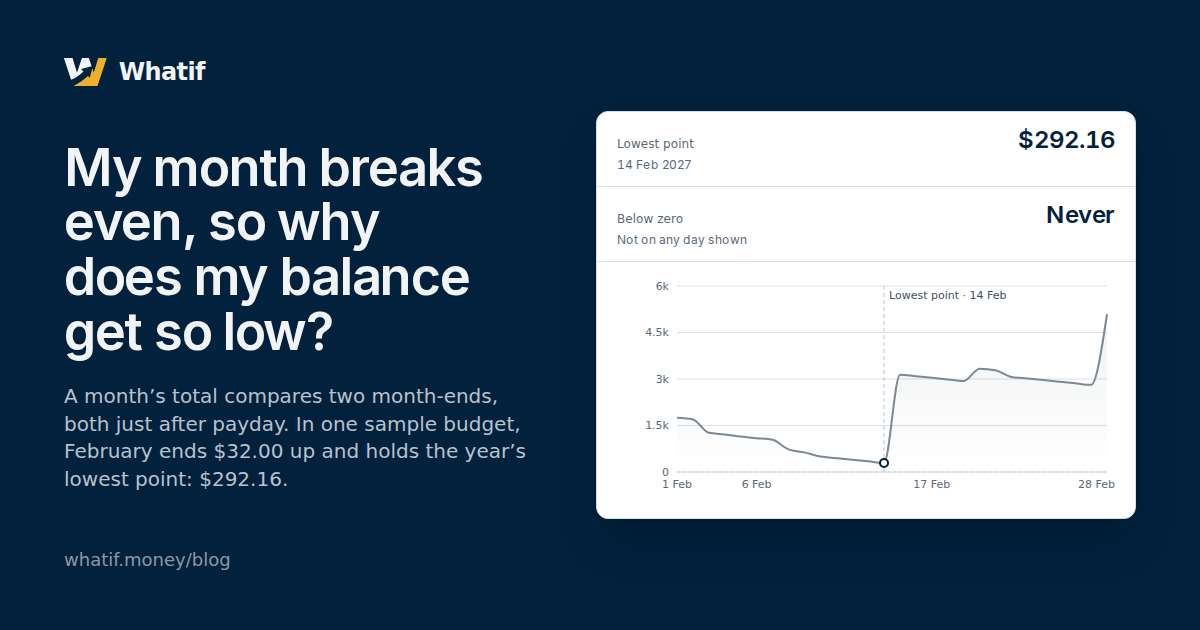
A month that breaks even ends about where the month before it ended. That is a comparison of two days, and if you are paid at the end of the month, both of them are days a paycheck has just landed on, among the highest your account sees all month. The bills on the 1st, the spending on every day after them and the wait for the next paycheck all happen between those two days, and none of it shows in the difference. A month can end even and spend half its days far below either end.
YNAB budgets the money you have today. It doesn’t walk your accounts forward a day at a time, so it can’t show how low the balance goes between one month-end and the next. A forecast does, and how Whatif forecasts a YNAB budget explains how one is worked out.
How low a month that ends even goes
Here it is in one budget: the Austin household, Whatif’s sample budget, forecast a day at a time from 11 November 2026. February 2027 starts from $5,057.68, the balance at the close of 31 January, and closes at $5,089.68: $32.00 better off. Its lowest point is $292.16, on 14 February, $4,765.52 below where it started. It is also the lowest point of the whole twelve-month forecast.
- Lowest point
- $292.16
- 14 Feb 2027
- Below zero
- Never
- Not on any day shown
On 1 February, $3,260.00 leaves in one day: childcare, the mortgage and the Visa payment. By the close of the 14th the dated items have taken $4,048.00 and the category spending $717.52, and nothing has arrived. The second half of the month gives it back: $2,900.00 of pay on the 15th, $450.00 of contract invoices on the 20th and $2,900.00 of pay on the 28th.
Why the month-end is the month’s highest day
The second paycheck lands on the last day of February, so the balance the month ends on, $5,089.68, is the highest of its 28 days. Every other day of February closes at least $1,755.01 below it.
That month-end balance holds pay that has not yet met the next month’s bills. On 1 March the same $3,260.00 leaves again, and with that day’s category spending the balance closes at $1,783.39.
What a month’s total says across a year
| Month | Starts from | Closes at | Month’s total | Lowest point | Below the start |
|---|---|---|---|---|---|
| December | $6,853.68 | $6,885.68 | $32.00 | $2,202.59 | $4,651.09 |
| January | $6,885.68 | $5,057.68 | −$1,828.00 | $329.59 | $6,556.09 |
| February | $5,057.68 | $5,089.68 | $32.00 | $292.16 | $4,765.52 |
| March | $5,089.68 | $5,140.37 | $50.69 | $393.59 | $4,696.09 |
| April | $5,140.37 | $5,574.37 | $434.00 | $422.69 | $4,717.69 |
| May | $5,574.37 | $6,026.37 | $452.00 | $896.29 | $4,678.09 |
| June | $6,026.37 | $6,433.37 | $407.00 | $1,326.69 | $4,699.69 |
| July | $6,433.37 | $7,435.04 | $1,001.67 | $2,349.95 | $4,083.42 |
| August | $7,435.04 | $8,487.04 | $1,052.00 | $3,401.95 | $4,033.09 |
| September | $8,487.04 | $9,539.04 | $1,052.00 | $4,432.35 | $4,054.69 |
| October | $9,539.04 | $10,591.04 | $1,052.00 | $5,505.95 | $4,033.09 |
| November | $10,591.04 | $11,643.04 | $1,052.00 | $6,518.35 | $4,072.69 |
In every one of the twelve months, the lowest point is on the 14th.
The month’s totals run from −$1,828.00 in January, the month the yearly auto insurance is paid, to $1,052.00 in each month from August. How far each month falls below where it started hardly follows them. Apart from January, it is never less than $4,033.09 and never more than $4,765.52, in a month that ends $32.00 up and in a month that gains $1,052.00 alike. What leaves between the 1st and the 14th is much the same every month, and that is what sets the fall. Why your YNAB balance is lowest the day before payday goes through those fourteen days item by item.
What a month’s total does decide is where the next month starts. From February on, every month closes above where it started, so each starts higher than the one before, and each month’s lowest point is higher than the last. A month’s lowest point is where it starts less what leaves before the first paycheck: breaking even holds the first of those still, and says nothing about the second.
- Lowest point
- $292.16
- 14 Feb 2027
- Below zero
- Never
- Not on any day shown
Finding it in your own budget
Whatif reads your YNAB budget — balances, scheduled transactions and targets — and forecasts it a day at a time, and shows the lowest point and the day it falls on. Each month of the forecast opens on its own page, a day at a time, with its lowest point and its day beside where it closes. The Austin household is the sample budget: open it to see February a day at a time, with no account needed, and nothing you change here is saved. To see how low your own months go between their month-ends, connect your YNAB budget; the fourteen-day trial needs no card.
How this was worked out
The household is the one the sample budget opens, forecast from 11 November 2026 to 30 November 2027 with its schedules and targets as they stand on that day. A month starts from the balance at the close of the day before it, because the balance on the 1st has already paid the 1st’s bills, and the month’s total is where it closes less where it started. Its lowest point is the lowest balance at the close of any of its days, the first of them when two are equal. The table leaves out November 2026, which the forecast joins on the 11th.