How much does cutting one category actually help?
A cut raises the lowest point only by what it has saved by that day. In one sample budget, $100 a month less on dining out lifts the year's low by $182.59.
By Fareed ·
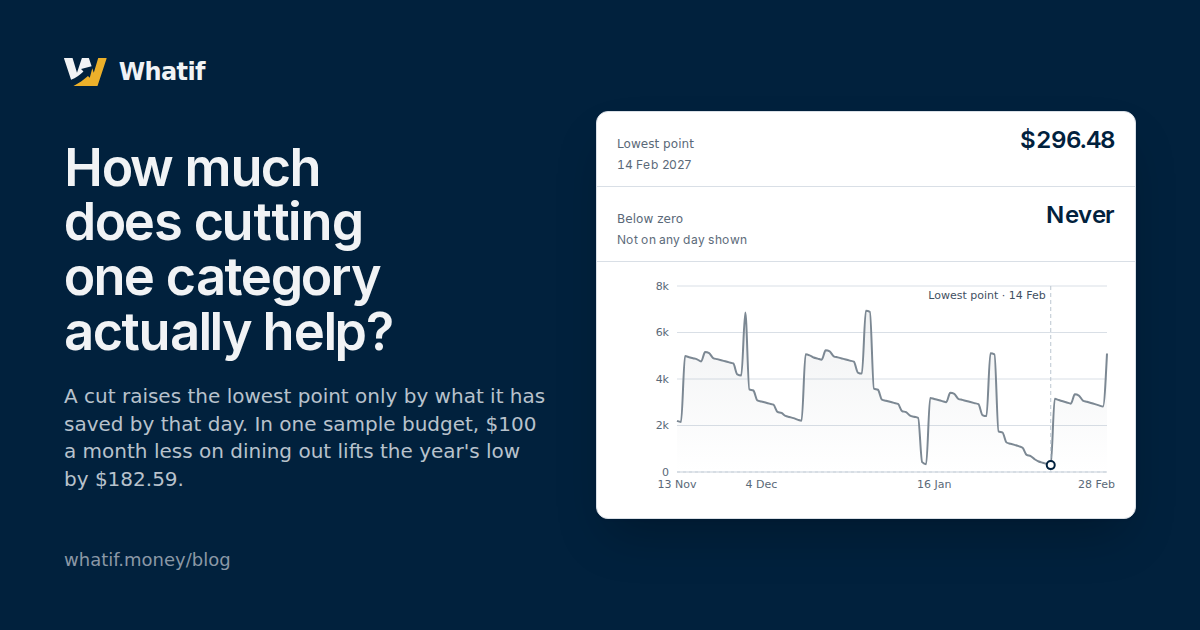
Spending less in one category saves its amount every month, and the saving adds up a little each day. Your balance on any day is higher by what the cut has saved up to that day, and no more. So a cut lifts the lowest point of your year by what it has saved by the lowest day, not by what it saves over the year. When that day is a few weeks after the cut starts, it gets a few weeks of it. And because the cut lifts later days more than earlier ones, the lowest day itself can move earlier, to a day that has had less of the saving.
YNAB budgets the money you have today, and a smaller target is a smaller job for that money each month. YNAB doesn’t walk your accounts forward a day at a time, so it can’t show which day of the year the cut reaches first, or how much of it has arrived by then. A forecast does, and how Whatif forecasts a YNAB budget explains how one is worked out.
How much of the cut reaches the lowest point
Here is one budget showing it: the Austin household, Whatif’s sample budget, forecast from 13 November 2026 to 30 November 2027. As it stands, its lowest point is $296.48, on 14 February. Its Dining out category has a YNAB target of $240.00 a month, and the forecast spends that. Take it to $140.00 a month from 1 December and change nothing else: the year’s spending falls by $1,200.00, and the lowest point is $479.07, on 14 January. The cut raises the year’s lowest point by $182.59.
- Lowest point
- $296.48
- 14 Feb 2027
- Below zero
- Never
- Not on any day shown
The chart is the budget as it stands. The forecast spreads a category’s month across its days, so the cut saves a little every day from 1 December: $45.16 by 14 December, $100.00 by the last day of December, and $145.16 by 14 January.
Why the lowest day moves
As it stands, the year’s two lowest months are January and February, and their lowest days are a month apart. The yearly auto insurance renews on 13 January, the day before the 14th, so January’s 14th is low, and February’s 14th is lower still. Why the balance is lowest after a yearly bill follows that renewal through the months after it.
The cut lifts February’s 14th more than January’s, because February has had a month more of it. That is enough to put January’s 14th underneath. The year’s lowest point is now the January one, a day that has had only $145.16 of the cut, and the $182.59 it rises by is measured from February’s old low.
| Month | Lowest point, as it stands | With the cut | On |
|---|---|---|---|
| November | $2,150.00 | $2,150.00 | 14 November |
| December | $2,206.91 | $2,252.07 | 14 December |
| January | $333.91 | $479.07 | 14 January |
| February | $296.48 | $546.49 | 14 February |
| March | $397.91 | $743.07 | 14 March |
| April | $427.81 | $874.47 | 14 April |
| May | $901.41 | $1,446.57 | 14 May |
| June | $1,331.81 | $1,978.47 | 14 June |
November does not move: the cut starts in December. From December on, each month’s lowest day is still the 14th, the day before the 15th’s paycheck, with the cut or without it.
Where the rest of the saving goes
The forecast closes on 30 November 2027 at $11,654.48 as it stands and $12,854.48 with the cut, $1,200.00 apart: the whole of it, twelve months from December to November. Most of that arrives after the year’s lowest day, when the line is already climbing. The auto loan is paid off on 28 March 2027 and the Visa card on 1 July 2027, and their payments stay in checking after that.
- Lowest point
- $296.48
- 14 Feb 2027
- Below zero
- Never
- Not on any day shown
A single expense is the other way round. It lowers every later day by its full amount at once, so a low that comes after it falls by all of it. A monthly cut reaches each later day only in part, and reaches the earliest of them least.
Finding it in your own budget
Whatif reads your YNAB budget — balances, scheduled transactions and targets — and forecasts it a day at a time. On What if, a scenario changes a category by a percentage and draws the result as a second line against the forecast before anything is saved, with the lowest point said under it. On the plan’s own spending rows, a figure being typed is drawn as a second line in the same way. None of it changes your YNAB budget. The Austin household is the sample budget: open it with no account needed, and nothing you change here is saved. To see what one category does to your own lowest point, connect your YNAB budget; the fourteen-day trial needs no card.
How this was worked out
The household is the one the sample budget opens, forecast from 13 November 2026 to 30 November 2027 with its schedules and targets as they stand on that day. The cut is a single category change, Dining out set to $140.00 a month from 1 December 2026 to the end of the forecast, folded over that forecast the way What if folds one, with nothing else changed. The saving by a day is the gap between the two forecasts at the close of that day. A month’s lowest point is the lowest balance at the close of any of its days, the first of them when two are equal.